A Simple Tutorial to and Running Pose Detection Python and MediaPipe
In this tutorial, I’ll walk you through the basics of two Python scripts for human pose detection using 3D keypoints from a video using MediaPipe, where the result is saved in JSON for each frame, and the second script to visualize results. Visualization can compare two keypoints frame to find the best movement pattern or compare yourself against someone else. We’ll cover how to set up the environment, run the scripts, and understand what they do. This tutorial aims to be simple and easy to follow, even if you're new to coding.
Step 1: Setting Up the Environment
To run these codes, you’ll need Python and some specific libraries. First, make sure you have Python 3 installed. I am using Python 3.10.6. Then, install the necessary packages by running the following command in your terminal or command prompt:
pip install matplotlib opencv-python mediapipe numpyThese libraries include:
Matplotlib for plotting the human skeleton in 3D.
OpenCV for capturing video and creating a GUI to interact with the video frames.
MediaPipe for detecting human pose keypoints in each frame
NumPy so common, right
Step 2: Capturing Keypoints from Video
The first script captures keypoints of human posture from a video and saves them to a JSON file. Here's a simple description of what the script does:
Initializing MediaPipe: The script uses MediaPipe's Pose solution to detect human body posture keypoints from each frame of the video.
Reading the Video: OpenCV is used to load the video from the specified path (
c:/pose/2.mov). The script processes each frame to detect poses.Extracting and Saving Keypoints: For every frame, the keypoints (x, y, z coordinates) are extracted using MediaPipe and saved into a list. At the end, these keypoints are written to a JSON file named
video_keypoints.json.Drawing Keypoints on Frames: The script also draws the detected keypoints and connections on each frame and saves an output video (
output_video_with_keypoints4.mp4) with the keypoints visualized.
Here is the complete code for capturing keypoints:
import cv2
import mediapipe as mp
import json

# Initialize Mediapipe pose detection
mp_pose = mp.solutions.pose
pose = mp_pose.Pose(static_image_mode=False, min_detection_confidence=0.5, min_tracking_confidence=0.5)

# Initialize OpenCV to capture video
video_path = "c:/pose/2.mov"
cap = cv2.VideoCapture(video_path)

# Video properties for output
frame_width = int(cap.get(cv2.CAP_PROP_FRAME_WIDTH))
frame_height = int(cap.get(cv2.CAP_PROP_FRAME_HEIGHT))
fps = int(cap.get(cv2.CAP_PROP_FPS))

# Initialize video writer to save output with keypoints drawn
output_video_path = "output_video_with_keypoints4.mp4"
fourcc = cv2.VideoWriter_fourcc(*'mp4v')
out = cv2.VideoWriter(output_video_path, fourcc, fps, (frame_width, frame_height))

# Data storage for keypoints
video_keypoints = []

# Define connection between keypoints (mediapipe landmark connections)
mp_drawing = mp.solutions.drawing_utils
mp_drawing_styles = mp.solutions.drawing_styles

frame_idx = 0
while cap.isOpened():
    ret, frame = cap.read()
    if not ret:
        break  # End of video

    # Convert frame to RGB as required by Mediapipe
    frame_rgb = cv2.cvtColor(frame, cv2.COLOR_BGR2RGB)

    # Perform pose detection
    results = pose.process(frame_rgb)

    # If any pose is detected
    if results.pose_landmarks:
        frame_keypoints = {
            'frame': frame_idx,
            'keypoints': {}
        }

        # Extract keypoints and store them in a dictionary
        for idx, landmark in enumerate(results.pose_landmarks.landmark):
            frame_keypoints['keypoints'][mp_pose.PoseLandmark(idx).name] = {
                'x': landmark.x,
                'y': landmark.y,
                'z': landmark.z,
                'visibility': landmark.visibility
            }

        # Append keypoints for this frame
        video_keypoints.append(frame_keypoints)

        # Draw the keypoints and the skeleton connections on the frame
        mp_drawing.draw_landmarks(
            frame,  # Frame to draw on
            results.pose_landmarks,  # The landmarks data
            mp_pose.POSE_CONNECTIONS,  # Connections to draw between landmarks
            landmark_drawing_spec=mp_drawing_styles.get_default_pose_landmarks_style()  # Styling
        )

    # Write the processed frame with keypoints drawn to the output video
    out.write(frame)

    frame_idx += 1

# Release resources
cap.release()
out.release()

# Save keypoints data to a JSON file
output_json = "video_keypoints.json"
with open(output_json, 'w') as f:
    json.dump(video_keypoints, f, indent=4)

print(f"Keypoints data saved to {output_json}")
print(f"Output video with keypoints saved to {output_video_path}")
To run this script, save it as extract_keypoints.py and run it with:
python extract_keypoints.pyStep 3: Understanding the JSON Input
The second script reads keypoints from the JSON file named video_keypoints.json generated by the first script. Make sure this file is in the same directory as your script or provide the correct path. The JSON file contains the keypoints for each frame in the video, which represent different body parts.
[
    {
        "frame": 0,
        "keypoints": {
            "NOSE": {
                "x": 0.7119289636611938,
                "y": 0.38939595222473145,
                "z": 0.021277766674757004,
                "visibility": 0.9999117851257324
            },
            "LEFT_EYE_INNER": {
                "x": 0.7113349437713623,
                "y": 0.3801867961883545,
                "z": 0.031760431826114655,
                "visibility": 0.9999250173568726
            },
            "LEFT_EYE": {
                "x": 0.7112080454826355,
                "y": 0.3798965513706207,
                "z": 0.031739480793476105,
                "visibility": 0.9999023675918579
            },
            "LEFT_EYE_OUTER": {
                "x": 0.711098313331604,
                "y": 0.3794894814491272,
                "z": 0.031679511070251465,
                "visibility": 0.999924898147583
            },
            "RIGHT_EYE_INNER": {
                "x": 0.7102025747299194,
                "y": 0.3793870806694031,
                "z": 0.010732440277934074,
                "visibility": 0.9999040365219116
And many more keypointsStep 4: Running the Visualization Code
To run the second script, save it as pose_detection.py and run it in your terminal:
python pose_detection.pyHere is the complete code for visualizing the keypoints:
import json
import matplotlib.pyplot as plt
from mpl_toolkits.mplot3d import Axes3D
import cv2
import numpy as np

# Load the keypoints JSON file
json_file = "video_keypoints.json"
with open(json_file, 'r') as f:
    keypoints_data = json.load(f)

# Extract keypoints for each frame (assuming single person data)
frames = [frame_data['keypoints'] for frame_data in keypoints_data]

# Define skeleton connections using Mediapipe body part labels
skeleton_connections = [
    ("NOSE", "LEFT_EYE_INNER"), ("LEFT_EYE_INNER", "LEFT_EYE"), ("LEFT_EYE", "LEFT_EYE_OUTER"),
    ("NOSE", "RIGHT_EYE_INNER"), ("RIGHT_EYE_INNER", "RIGHT_EYE"), ("RIGHT_EYE", "RIGHT_EYE_OUTER"),
    ("NOSE", "LEFT_SHOULDER"), ("LEFT_SHOULDER", "LEFT_ELBOW"), ("LEFT_ELBOW", "LEFT_WRIST"),
    ("NOSE", "RIGHT_SHOULDER"), ("RIGHT_SHOULDER", "RIGHT_ELBOW"), ("RIGHT_ELBOW", "RIGHT_WRIST"),
    ("LEFT_SHOULDER", "LEFT_HIP"), ("LEFT_HIP", "LEFT_KNEE"), ("LEFT_KNEE", "LEFT_ANKLE"),
    ("RIGHT_SHOULDER", "RIGHT_HIP"), ("RIGHT_HIP", "RIGHT_KNEE"), ("RIGHT_KNEE", "RIGHT_ANKLE")
]

# Adjust the body orientation by rotating keypoints (if needed)
def adjust_orientation(keypoints):
    adjusted_keypoints = {}
    for part, (x, y, z) in keypoints.items():
        # This adjustment assumes that z should be up, and y is the depth (swap y and z)
        adjusted_keypoints[part] = (x, z, -y)  # Adjust this depending on actual data orientation
    return adjusted_keypoints

# Function to extract keypoints from a frame and return (x, y, z) coordinates for labeled parts
def extract_keypoints(frame_keypoints):
    keypoints = {}
    for part, coords in frame_keypoints.items():
        keypoints[part] = (coords['x'], coords['y'], coords['z'])
    return adjust_orientation(keypoints)  # Adjust orientation of keypoints

# Function to calculate the bounding box of keypoints for dynamic plot scaling
def calculate_bounding_box(keypoints):
    coords = np.array(list(keypoints.values()))
    x_min, y_min, z_min = coords.min(axis=0)
    x_max, y_max, z_max = coords.max(axis=0)
    return x_min, x_max, y_min, y_max, z_min, z_max

# Function to draw the head as a sphere (approximated)
def draw_head(ax, head_center, head_radius=0.02, color='blue'):
    u = np.linspace(0, 2 * np.pi, 10)
    v = np.linspace(0, np.pi, 10)
    x = head_radius * np.outer(np.cos(u), np.sin(v)) + head_center[0]
    y = head_radius * np.outer(np.sin(u), np.sin(v)) + head_center[1]
    z = head_radius * np.outer(np.ones(np.size(u)), np.cos(v)) + head_center[2]
    ax.plot_surface(x, y, z, color=color)

# Function to plot keypoints and draw a person figure in 3D
def plot_human_figure(ax, keypoints, color='blue', label="Frame"):
    keypoints_coords = {part: (kp[0], kp[1], kp[2]) for part, kp in keypoints.items()}

    # Plot keypoints and skeleton connections
    for connection in skeleton_connections:
        part_a, part_b = connection
        if part_a in keypoints_coords and part_b in keypoints_coords:
            ax.plot(
                [keypoints_coords[part_a][0], keypoints_coords[part_b][0]],
                [keypoints_coords[part_a][1], keypoints_coords[part_b][1]],
                [keypoints_coords[part_a][2], keypoints_coords[part_b][2]],
                color=color
            )

    # Draw head if NOSE keypoint exists
    if "NOSE" in keypoints_coords:
        draw_head(ax, keypoints_coords["NOSE"], color=color)

# Function to update the plot based on the two trackbar values and preserve current view
def update_plot(frame_idx1, frame_idx2, preserve_view=True):
    if preserve_view:
        current_elev = ax.elev
        current_azim = ax.azim

    ax.clear()

    # Extract and plot keypoints for both frames
    keypoints1 = extract_keypoints(frames[frame_idx1])
    keypoints2 = extract_keypoints(frames[frame_idx2])

    plot_human_figure(ax, keypoints1, color='blue', label=f"Frame {frame_idx1}")
    plot_human_figure(ax, keypoints2, color='red', label=f"Frame {frame_idx2}")

    # Calculate combined bounding box and adjust the plot limits
    x_min_1, x_max_1, y_min_1, y_max_1, z_min_1, z_max_1 = calculate_bounding_box(keypoints1)
    x_min_2, x_max_2, y_min_2, y_max_2, z_min_2, z_max_2 = calculate_bounding_box(keypoints2)

    x_min, x_max = min(x_min_1, x_min_2), max(x_max_1, x_max_2)
    y_min, y_max = min(y_min_1, y_min_2), max(y_max_1, y_max_2)
    z_min, z_max = min(z_min_1, z_min_2), max(z_max_1, z_max_2)

    ax.set_xlim(x_min - 0.1, x_max + 0.1)
    ax.set_ylim(y_min - 0.1, y_max + 0.1)
    ax.set_zlim(z_min - 0.1, z_max + 0.1)

    ax.set_title(f"Comparison of Frame {frame_idx1} (blue) and Frame {frame_idx2} (red)")

    if preserve_view:
        ax.view_init(elev=current_elev, azim=current_azim)

    fig.canvas.draw()

# Recording functionality
is_recording = False
video_writer = None
output_video_path = "frame_comparison_video.mp4"

def start_stop_recording():
    global is_recording, video_writer

    if is_recording:
        # Stop recording
        is_recording = False
        video_writer.release()
        video_writer = None
        print("Recording stopped.")
    else:
        # Start recording
        is_recording = True
        # Define video writer (assuming screen resolution or adjust as necessary)
        width, height = fig.canvas.get_width_height()  # Actual figure size
        fourcc = cv2.VideoWriter_fourcc(*'mp4v')
        video_writer = cv2.VideoWriter(output_video_path, fourcc, 20.0, (width, height))
        print("Recording started.")

def record_frame():
    # Save the current Matplotlib figure as a frame
    fig.canvas.draw()
    img = np.frombuffer(fig.canvas.tostring_rgb(), dtype=np.uint8)
    width, height = fig.canvas.get_width_height()
    img = img.reshape(height, width, 3)
    img_bgr = cv2.cvtColor(img, cv2.COLOR_RGB2BGR)

    # Write the frame to the video
    video_writer.write(img_bgr)

# OpenCV trackbar callback for left frame
def on_trackbar_left(val):
    global left_frame_idx, right_frame_idx
    left_frame_idx = val
    update_plot(left_frame_idx, right_frame_idx)
    if is_recording:
        record_frame()

# OpenCV trackbar callback for right frame
def on_trackbar_right(val):
    global left_frame_idx, right_frame_idx
    right_frame_idx = val
    update_plot(left_frame_idx, right_frame_idx)
    if is_recording:
        record_frame()

# Initialize the plot
fig = plt.figure()
ax = fig.add_subplot(111, projection='3d')

# Initial frame indices
left_frame_idx = 0
right_frame_idx = 0

# Initialize the OpenCV window with two trackbars and a recording button
cv2.namedWindow('Trackbar Window')

# Trackbar for selecting the left frame
cv2.createTrackbar('Left Frame', 'Trackbar Window', 0, len(frames) - 1, on_trackbar_left)

# Trackbar for selecting the right frame
cv2.createTrackbar('Right Frame', 'Trackbar Window', 0, len(frames) - 1, on_trackbar_right)

# Add a record button (toggle recording)
def on_record_button(val):
    if val == 1:
        start_stop_recording()
        cv2.setTrackbarPos('Record', 'Trackbar Window', 0)

# Trackbar to toggle recording (acts as a button)
cv2.createTrackbar('Record', 'Trackbar Window', 0, 1, on_record_button)

# Display the initial comparison
update_plot(0, 0, preserve_view=False)
plt.show()

cv2.destroyAllWindows()
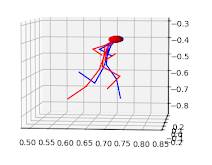
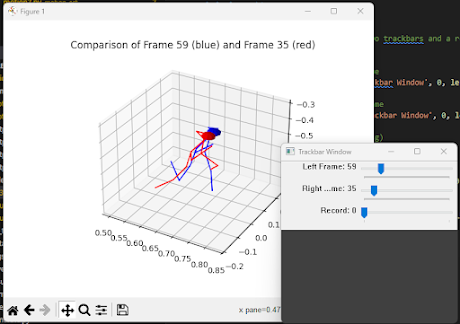
The script will open a window with three sliders to compare keypoints from different frames of a video. Basically, you can set the frames to compare.
Step 5: Interacting with the Output
The code uses two trackbars to let you select frames and compare them side by side. You’ll see a figure that updates as you adjust the sliders.
There’s also an option to start and stop recording the output as a video, which is saved as
frame_comparison_video.mp4.
Summary
These codes work together to capture and visualize 3D human pose data from a video. The first script extracts keypoints and saves them to a JSON file, while the second script visualizes these keypoints to help you better understand body movement by comparing frames from a video. If you have keypoint data in the correct format, you can quickly set this up and start visualizing.
Feel free to modify the scripts to change the way the skeleton is drawn or to add new features!


